Projet portfolio individuel
Projet / Rentabilité
Rentabilité e-commerce & fuites de marge
Problème métier
Où la marge se dégrade-t-elle ?
- Commandes analysées
- 12 000
- Chiffre d'affaires
- 2 054 589 €
- Marge
- 214 041 €
Problème métier
La question posée par le métier.
Ce projet portfolio examine où la rentabilité se dégrade selon les catégories, les régions et les politiques de remise, à partir de données de commandes e-commerce.
- Question
Où la marge se dégrade-t-elle ?
- Périmètre
12 000 commandes · CA · Coûts · Marge · Remises
- Attendu
Priorisation des fuites de marge et des leviers d'amélioration de la rentabilité.
- Décision visée
Revoir la politique de remise sur l'Électronique en UE — zone d'érosion de marge la plus forte
Données & méthode
Comment les données ont été préparées.
Origine des données, étapes de traitement et contrôles appliqués avant analyse.
Méthode
- 01
Construction d'une couche analytique DuckDB au niveau commande (12 000 commandes)
- 02
Calcul du chiffre d'affaires, de la marge, du taux de marge et des remises par segment
- 03
Identification des commandes à perte et des couples catégorie × région les plus fragiles
- 04
Visualisation des facteurs de rentabilité dans Tableau pour les équipes métiers
- 05
Traduction des résultats SQL en recommandations commerciales actionnables
Contrôles qualité
- 01
Couche SQL DuckDB et requêtes KPI documentées
- 02
Pipeline Python de génération, validation et export du jeu de données
- 03
Classeur Tableau et capture du dashboard
- 04
Dépôt GitHub reproductible
Outils mobilisés
- SQL
- Tableau
- Python
KPI
Les indicateurs suivis.
Les indicateurs retenus pour répondre à la question métier, et le reporting qui les restitue.
- Commandes analysées
- 12 000
- Chiffre d'affaires
- 2 054 589 €
- Marge
- 214 041 €
- Taux de marge
- 10,42 %
- Remise moyenne
- 17,39 %
- Part de commandes à perte
- 16,01 %
Rentabilité e-commerce / restitution principale
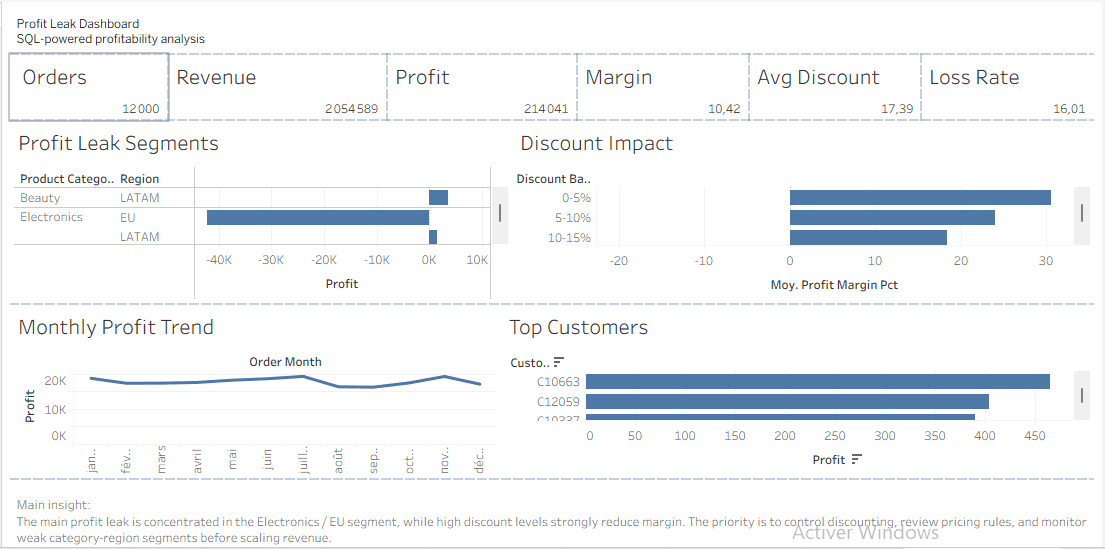
Dashboard de rentabilité — vue remises et catégorie × région
Analyse
Ce que montrent les indicateurs.
Lecture des écarts et des tendances observés dans les données du projet.
Pression sur la rentabilité
Chiffre d'affaires → marge → taux de marge- 01
Taux de marge
10,42 % - 02
Remise moyenne
17,39 % - 03
Part de commandes à perte
16,01 %
Constat principal
La fuite de marge se concentre sur le couple Électronique / UE, et les niveaux de remise élevés dégradent systématiquement la marge.
Décision & recommandation
Ce que l'analyse change pour le métier.
Priorités et actions déduites des résultats observés.
Recommandations
Actions proposées
Les recommandations découlent des résultats de ce projet portfolio ; aucun gain testé ni impact business observé n'est revendiqué.- 01
Revoir la politique de remise sur l'Électronique en UE — zone d'érosion de marge la plus forte
- 02
Plafonner la profondeur promotionnelle sur les catégories à marge de contribution négative
- 03
Suivre la part de commandes à perte chaque semaine comme KPI avancé de rentabilité
- 04
Prioriser les correctifs d'assortiment et de prix sur les segments catégorie × région les plus fragiles
Limites
Ce que ce travail revendique — et ne revendique pas.
Origine des données, réalisation et limites matérielles restent dans le fil de lecture.
- 01Type de projet
- Projet portfolio individuel
- 02Réalisation
- Projet individuel de bout en bout
- 03Origine et périmètre des données
- Données de commandes e-commerce synthétiques générées avec Python. L'analyse porte sur 12 000 commandes simulées et ne représente pas la performance d'une entreprise réelle.
Sources
Consulter le travail.
Dépôt, méthodologie et livrables analytiques du projet.
- 01Générateur de données synthétiques(ouvre un nouvel onglet)
Générateur Python à graine fixe définissant les distributions par catégorie et région, les profils de remise et de coût, et des scénarios explicites de fuite de marge.
- 02Modèle de préparation de la marge(ouvre un nouvel onglet)
Transformation SQL au niveau commande calculant la marge, le taux de marge, les tranches de remise et la maille mensuelle de reporting.
- 03SQL des KPI de synthèse(ouvre un nouvel onglet)
Agrégats SQL sur les commandes, le chiffre d'affaires, les coûts, la marge, le taux de marge, la remise moyenne et la part de commandes à perte.
- 04SQL des segments en fuite de marge(ouvre un nouvel onglet)
Analyse croisée catégorie × région classant les segments les plus faibles en marge et en rentabilité.
- 05Classeur Tableau(ouvre un nouvel onglet)
Classeur Tableau consultable, connecté aux sorties de rentabilité générées par le projet.
Les KPI de revenu sont-ils fiables avant que le Customer Success priorise ses comptes ?