Projet portfolio individuel
Projet / Data Quality & Aide à la décision
RenewalOS
Fiabilité du revenu B2B & priorisation Customer Success
Problème métier
Les KPI de revenu sont-ils fiables avant que le Customer Success priorise ses comptes ?
- Sources de données
- 7
- Profondeur d'historique
- 24 mois
- Comptes du portefeuille
- 750
Problème métier
La question posée par le métier.
Les équipes B2B agissent souvent sur des signaux d'ARR, de churn, de renouvellement et de santé des comptes avant que les problèmes des systèmes sources ne soient visibles. RenewalOS montre un workflow analytique où les exceptions de données, les écarts de réconciliation et les règles de décision sont exposés avant que la priorisation Customer Success ne soit revue.
- Question
Les KPI de revenu sont-ils fiables avant que le Customer Success priorise ses comptes ?
- Périmètre
Portefeuille 24 mois · 7 sources · Réconciliation ARR · Contrôles qualité · Priorisation sous contrainte
- Attendu
Détection des incidents qualité avant reporting, puis priorisation d'un portefeuille CRM sous contrainte de capacité.
- Décision visée
Revoir les exceptions qualité avant de traiter l'ARR, le churn ou le renouvellement comme des KPI de pilotage
Données & méthode
Comment les données ont été préparées.
Origine des données, étapes de traitement et contrôles appliqués avant analyse.
Méthode
- 01
Génération de données sources synthétiques : contrats, facturation, usage, support et activité Customer Success
- 02
Chargement des enregistrements non fiabilisés dans DuckDB et modélisation des couches de l'entrepôt avec dbt
- 03
Application des contrôles qualité et de la réconciliation du revenu avant tout reporting de KPI
- 04
Construction d'un diagnostic de santé des comptes explicable, exceptions sources toujours visibles
- 05
Production de scénarios de priorisation CSM sous contrainte de capacité, avec exclusions explicites
Architecture
- 01
Sept domaines sources alimentent un entrepôt DuckDB local modélisé avec dbt (26 modèles : staging, intermediate, qualité, marts).
- 02
Les contrôles qualité et la réconciliation du revenu font remonter les exceptions sources avant l'usage des vues destinées aux KPI.
- 03
Le diagnostic de santé des comptes explicite les signaux de risque tout en conservant les enregistrements bloqués ou exclus.
- 04
OR-Tools applique des limites de capacité CSM simulées aux scénarios de recommandation, et non à des décisions de production.
Preuves et contrôles qualité
- Entrepôt DuckDB modélisé avec dbt
- Contrôles qualité et réconciliation du revenu
- Diagnostic de santé des comptes explicable
- Démonstration Streamlit publique et dépôt GitHub
Outils mobilisés
- SQL
- dbt
- DuckDB
- Python
- Streamlit
KPI
Les indicateurs suivis.
Les indicateurs retenus pour répondre à la question métier, et le reporting qui les restitue.
- Sources de données
- 7
- Profondeur d'historique
- 24 mois
- Comptes du portefeuille
- 750
- Scénarios qualité couverts
- 14
- Modèles dbt
- 26
- Réconciliation
- ARR
RenewalOS / restitution principale
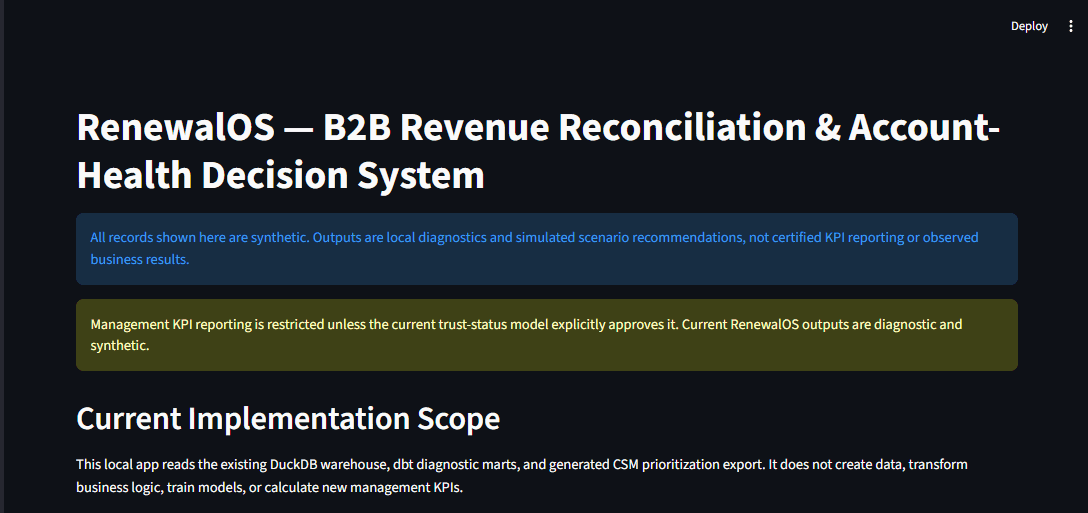
Control Tower RenewalOS — contrôles qualité et statut du reporting KPI
Vue de diagnostic complémentaire
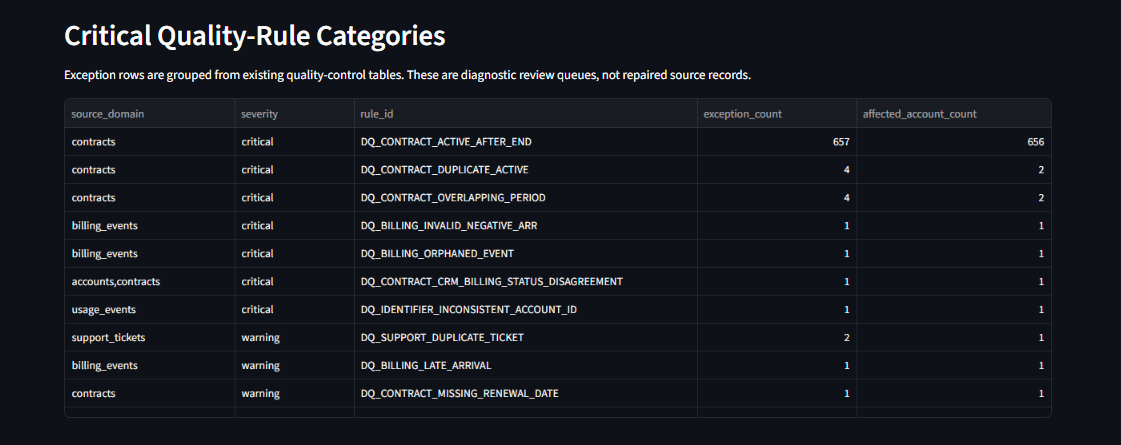
Le diagnostic Data Trust rend les exceptions sources visibles avant la lecture des KPI ou des scénarios de priorisation.
Analyse
Ce que montrent les indicateurs.
Lecture des écarts et des tendances observés dans les données du projet.
Contrôle qualité avant reporting
Exceptions visibles avant toute sortie décisionnelle- Étape 01
Sources de données
7 - Étape 02
Scénarios qualité couverts
14 - Étape 03
Réconciliation
ARR
- Profondeur d'historique
- 24 mois
- Comptes du portefeuille
- 750
- Modèles dbt
- 26
Constat principal
Les sorties décisionnelles restent restreintes tant que les exceptions sources et les écarts de réconciliation ne sont pas visibles et revus.
Décision & recommandation
Ce que l'analyse change pour le métier.
Priorités et actions déduites des résultats observés.
Recommandations
Actions proposées
Les recommandations découlent des résultats de ce projet portfolio ; aucun gain testé ni impact business observé n'est revendiqué.- 01
Revoir les exceptions qualité avant de traiter l'ARR, le churn ou le renouvellement comme des KPI de pilotage
- 02
Traiter les écarts de réconciliation comme des points bloquants exigeant une preuve, plutôt que de les lisser manuellement
- 03
Considérer la priorisation CSM comme une simulation de scénarios tant qu'elle n'est pas validée sur données réelles
- 04
Garder les enregistrements exclus visibles pour que les arbitrages de capacité ne masquent pas les problèmes de fiabilité
Limites
Ce que ce travail revendique — et ne revendique pas.
Origine des données, réalisation et limites matérielles restent dans le fil de lecture.
- 01Type de projet
- Projet portfolio individuel
- 02Réalisation
- Projet individuel de bout en bout
- 03Origine et périmètre des données
- Données B2B synthétiques uniquement. Aucune donnée client de production, aucun déploiement en production, aucun résultat d'intervention observé ni impact business réel n'est revendiqué.
Limites matérielles
- Le projet repose uniquement sur des données synthétiques.
- Les sorties sont diagnostiques et ne constituent pas un reporting de KPI de pilotage fiabilisé.
- La priorisation CSM est une analyse de scénarios simulée, pas une preuve d'intervention observée.
- Aucun impact business, résultat client ou niveau de précision de modèle n'est revendiqué.
- Aucun déploiement en production n'est configuré ni revendiqué.
Sources
Consulter le travail.
Dépôt, méthodologie et livrables analytiques du projet.
- 01Génération et validation des sources(ouvre un nouvel onglet)
Couche reproductible de génération et de validation des données sources, qui injecte puis détecte 14 scénarios d'incidents qualité contrôlés.
- 02Contrôle qualité des KPI(ouvre un nouvel onglet)
Modèle dbt qui bloque, nuance ou déclare non évaluables les métriques de revenu selon les preuves de qualité et de réconciliation.
- 03Validation des contrôles qualité(ouvre un nouvel onglet)
Couche de validation vérifiant la couverture des incidents, les métadonnées d'exception, les statuts qualité et les écarts de réconciliation.
- 04Méthodologie de santé des comptes(ouvre un nouvel onglet)
Documentation des contrôles qualité, des composantes de score, des seuils simulés, de la logique d'explication et des limites.
- 05Optimiseur sous contrainte de capacité(ouvre un nouvel onglet)
Optimiseur de scénarios (OR-Tools) sélectionnant les comptes éligibles sous contrainte d'heures CSM et de nombre de comptes.
Où les utilisateurs abandonnent-ils avant l'achat ?