Projet portfolio individuel
Projet / CRM & Segmentation
Segmentation RFM & recommandations CRM
Problème métier
Quels clients le CRM doit-il prioriser ?
- Clients analysés
- 5 000
- Commandes
- 45 356
- Chiffre d'affaires
- 4 522 014 €
Problème métier
La question posée par le métier.
Ce projet portfolio construit une segmentation client fondée sur la récence, la fréquence et le montant d'achat, afin de prioriser les actions de rétention et de réactivation.
- Question
Quels clients le CRM doit-il prioriser ?
- Périmètre
5 000 clients · VIP · Loyaux · À risque · Perdus
- Attendu
Actions de rétention et de réactivation adaptées à chaque segment client.
- Décision visée
Rétention VIP : programme de fidélité, offres exclusives, suivi de compte proactif
Données & méthode
Comment les données ont été préparées.
Origine des données, étapes de traitement et contrôles appliqués avant analyse.
Méthode
- 01
Calcul des scores RFM sur 5 000 clients et 45 356 commandes
- 02
Segmentation des clients en groupes VIP, Loyaux, À risque et Perdus
- 03
Quantification de la concentration du chiffre d'affaires par segment
- 04
Définition de règles de priorisation CRM fondées sur l'économie de chaque segment
- 05
Traduction des résultats en recommandations actionnables par segment
Contrôles qualité
- 01
Agrégation client avec Python et pandas
- 02
Règles de scoring et de segmentation RFM documentées
- 03
Sorties KPI générées et analyse visuelle
- 04
Dépôt GitHub reproductible
Outils mobilisés
- Python
- pandas
KPI
Les indicateurs suivis.
Les indicateurs retenus pour répondre à la question métier, et le reporting qui les restitue.
- Clients analysés
- 5 000
- Commandes
- 45 356
- Chiffre d'affaires
- 4 522 014 €
- Part VIP
- 27,9 % des clients · 75,4 % du CA
- Part Perdus
- 23,62 % des clients · 2,95 % du CA
Segmentation RFM / restitution principale
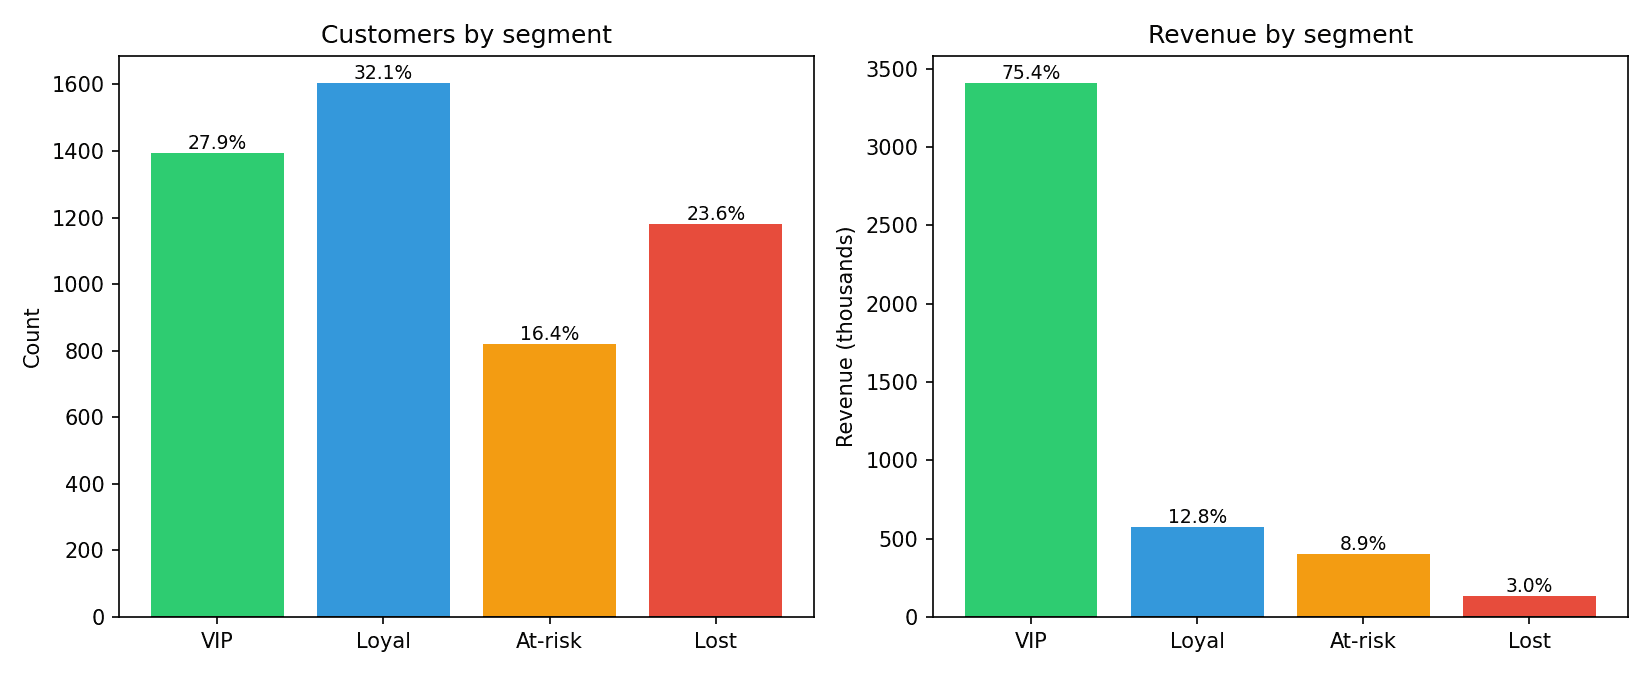
Dashboard de segmentation RFM — répartition des segments et chiffre d'affaires
Analyse
Ce que montrent les indicateurs.
Lecture des écarts et des tendances observés dans les données du projet.
Concentration client
Part des clients comparée à la part du chiffre d'affaires- 0127,9 % des clients · 75,4 % du CA
VIP
Priorité rétention
- 0223,62 % des clients · 2,95 % du CA
Perdus
Priorité basse en campagne de masse
Constat principal
Le chiffre d'affaires est fortement concentré : les clients VIP (27,9 %) génèrent 75,4 % du CA, tandis que les clients Perdus (23,62 %) n'en représentent que 2,95 % — un signal de priorisation CRM très clair.
Décision & recommandation
Ce que l'analyse change pour le métier.
Priorités et actions déduites des résultats observés.
Recommandations
Actions proposées
Les recommandations découlent des résultats de ce projet portfolio ; aucun gain testé ni impact business observé n'est revendiqué.- 01
Rétention VIP : programme de fidélité, offres exclusives, suivi de compte proactif
- 02
Réactivation À risque : campagnes email ciblées avant bascule vers le segment Perdus
- 03
Upsell et cross-sell sur le segment Loyaux pour le faire progresser vers le statut VIP
- 04
Dépriorisation des campagnes de masse sur le segment Perdus au profit du segment À risque récupérable
Limites
Ce que ce travail revendique — et ne revendique pas.
Origine des données, réalisation et limites matérielles restent dans le fil de lecture.
- 01Type de projet
- Projet portfolio individuel
- 02Réalisation
- Projet individuel de bout en bout
- 03Origine et périmètre des données
- Données de commandes e-commerce synthétiques, mais réalistes d'un point de vue métier, générées avec Python. Le jeu de données contient 5 000 clients simulés et 45 356 commandes, et ne représente pas une entreprise réelle.
Sources
Consulter le travail.
Dépôt, méthodologie et livrables analytiques du projet.
- 01Générateur de données synthétiques(ouvre un nouvel onglet)
Générateur Python à graine fixe définissant les profils de comportement client, la fréquence de commande, la récence et la distribution du chiffre d'affaires.
- 02Pipeline de scoring RFM(ouvre un nouvel onglet)
Agrégation au niveau client, scoring par quintiles, affectation de segments mutuellement exclusifs et export des KPI.
- 03Métriques d'exécution versionnées(ouvre un nouvel onglet)
Sortie exploitable par machine contenant le nombre de clients, de commandes, le chiffre d'affaires et les résultats exacts par segment.
- 04Synthèse par segment(ouvre un nouvel onglet)
Nombre de clients, part de chiffre d'affaires et revenu moyen par client, publiés pour chaque segment.
- 05Playbook CRM(ouvre un nouvel onglet)
Actions métiers, idées de campagnes et KPI de suivi pour les segments VIP, Loyaux, À risque et Perdus.
Où la marge se dégrade-t-elle ?